
SaaS Observability in 2026: A Developer's Guide to Logs, Metrics, and Distributed Tracing
August 14, 2026
Most SaaS teams treat observability as something they’ll add after launch — after the first major incident that left them guessing what broke, whose request triggered it, and why the error rate spiked only for users in one region. That pattern is avoidable, and increasingly so: the tooling for production-grade observability has matured considerably, and the cost of instrumenting a new service from day one is far lower than backfilling it into a running system that’s accumulating users.
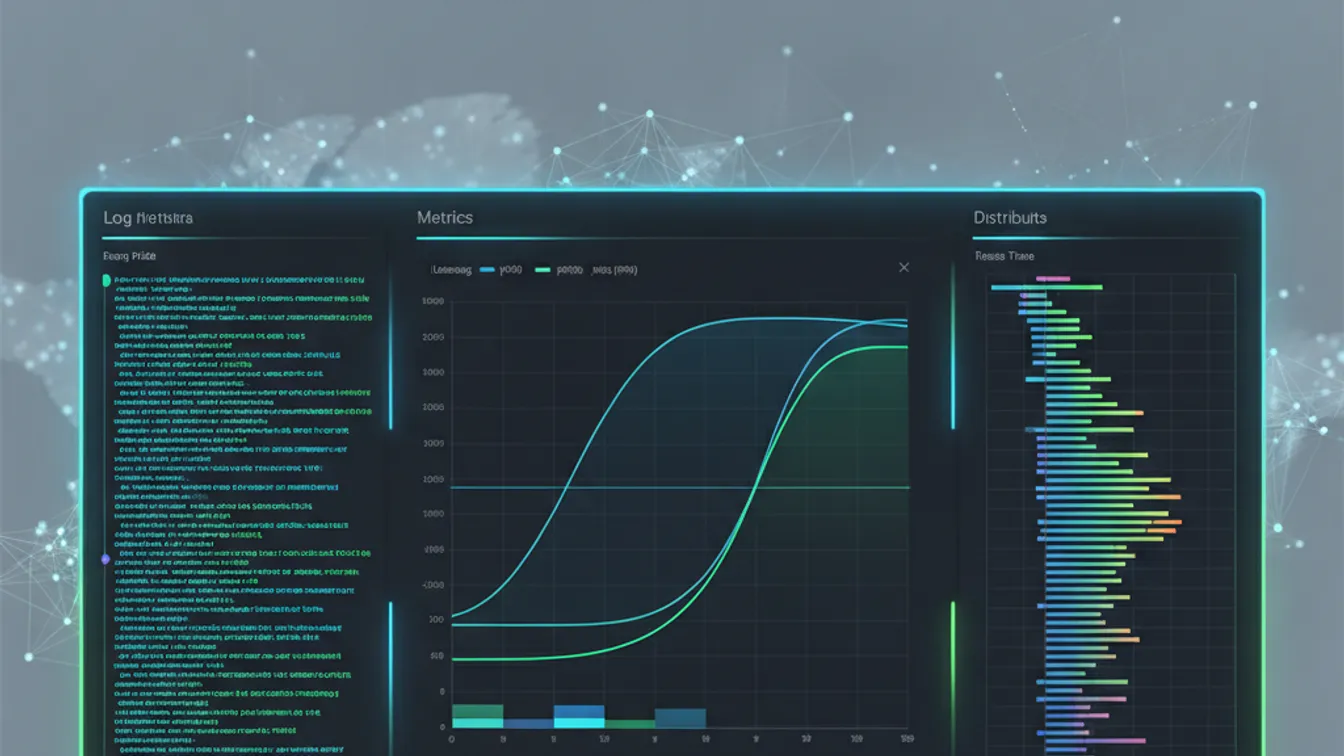
This guide covers the three core pillars of observability — logs, metrics, and distributed tracing — and the practical decisions that determine whether your observability stack helps you ship faster or just adds noise.
Why Observability Is Not the Same as Monitoring
Monitoring tells you when something is wrong. A dashboard turns red, an alert fires, on-call gets paged. The assumption is that you already know which failure modes to watch for.
Observability tells you why something is wrong, including failure modes you didn’t anticipate. An observable system lets you ask arbitrary questions about its behaviour — “why are exactly 3% of requests from users in the EU failing?”, “which downstream service is adding 400ms to the p99 checkout latency?”, “did this deploy cause the spike or was it already trending up?” — without having to ship new instrumentation just to get the data needed to answer them.
In a SaaS product with multiple services, async jobs, third-party integrations, and tenants each generating distinct workloads, monitoring gives you a limited picture. Observability gives you the full one.
Pillar 1: Structured Logging
Logs are the oldest observability primitive, and also the most commonly misused. Unstructured log lines — "ERROR: failed to process payment for user 8492" — are nearly worthless at scale. They can’t be filtered efficiently, can’t be aggregated, and can’t be correlated across services without heroic grep gymnastics.
Structured logs are JSON objects. Every event your application emits should include:
- A severity level (
info,warn,error) - A timestamp (ISO 8601, UTC)
- A service name and version
- A correlation ID (more on this under tracing)
- The user ID and tenant ID, where applicable
- The structured data specific to that event (payment method type, order ID, etc.)
The single highest-value change most SaaS teams can make to their logging posture is switching from string concatenation to a structured logger — pino in Node.js, zerolog in Go, structlog in Python, Serilog in .NET. The performance improvement is a bonus; the real gain is that every log event becomes queryable.
What to log (and what not to). Log the boundaries: requests in, responses out, downstream calls made, background jobs started and finished. Log decisions that affect user experience: payment declined, feature flag evaluated to false, rate limit hit. Do not log inside tight loops, and do not log sensitive data — passwords, tokens, raw card numbers, or PII that your privacy policy doesn’t account for. Log verbosity should be configurable per environment without a deploy.
Log storage. For teams on AWS, CloudWatch Logs Insights handles moderate volumes reasonably well. Beyond that, routing logs to an S3-backed data lake (with Athena for ad-hoc queries) or a purpose-built tool like Grafana Loki dramatically reduces cost at scale. The key is indexing selectively: full-text indexing of every byte of log data is expensive; structured field indexing on the attributes you’ll actually query is not.
Pillar 2: Metrics
Metrics are numeric measurements over time. Where logs tell you what happened, metrics tell you how often, how fast, and how much. They’re the foundation of SLA tracking, capacity planning, alerting, and the business-level dashboards that tell you whether things are getting better or worse.
Every SaaS platform should instrument, at minimum, the RED signals for every service:
- Rate: requests per second (or events per second for async services)
- Errors: the proportion of requests returning an error
- Duration: latency distribution, specifically p50, p95, and p99 — not just mean
These three numbers, broken down by endpoint and by tenant tier, give you most of the signal you need for day-to-day reliability. Add them to every new service before it handles production traffic, not after.
Beyond RED, the metrics worth capturing early:
- Database query latency by query type and table — slow queries almost always show up in p99 long before they surface as user complaints
- Queue depth and age for any async processing — a queue that’s growing and not draining is a production incident waiting to happen
- External API error rates by vendor — third-party dependencies fail, and you want to know whether an incident is yours or theirs before you wake up the team
- Business metrics in the same pipeline — conversion rate, successful checkouts, active sessions — so you can correlate a deployment with business impact, not just infrastructure impact
For the instrumentation layer, OpenTelemetry has become the standard. Vendor-agnostic, language SDKs for every major runtime, and a collector that routes to any backend. Lock in on OpenTelemetry instrumentation early, and you preserve the option to change backends later without re-instrumenting.
Pillar 3: Distributed Tracing
Distributed tracing is the most powerful pillar and the most commonly skipped. It’s also the one that pays back most visibly once you’ve used it for the first time to diagnose a latency spike that crossed four services, an async worker, and a caching layer.
A trace represents a single request’s journey through your system. Each unit of work — an HTTP handler, a database query, a Redis call, a downstream API request — is a span. Spans are nested (child spans for sub-operations) and carry their own timing, attributes, and status. A trace visualisation looks like a waterfall diagram: you see exactly where time is being spent, which call is the bottleneck, and which service returned the error that bubbled up.
The key implementation detail is the correlation ID (also called a trace ID): a random identifier generated at the entry point of every request, propagated through every downstream call via HTTP headers (traceparent in the W3C Trace Context standard), and included in every log event and metric label. This is what makes it possible to jump from a specific log line to the full trace that produced it, or from a slow-query metric to the user request that triggered it.
In practice, getting distributed tracing working requires:
- Instrumenting your HTTP clients to propagate the
traceparentheader on outbound calls - Instrumenting your servers to read it from incoming requests
- Running an OpenTelemetry collector that ships spans to a backend (Jaeger, Tempo, Honeycomb, Datadog APM, or a cloud-native option)
- Including the trace ID in every structured log event
Steps 1–3 are often handled automatically by auto-instrumentation packages for your framework. The manual work is step 4, and it’s worth doing explicitly — the ability to jump from a log event to a trace is where the real debugging power lives.
Putting the Three Pillars Together
Observability’s leverage comes from correlating across all three pillars. An alert fires on an error rate spike (metrics). You open the logs for the time window and see a pattern — the errors are all coming from one specific API endpoint (logs). You click into a trace for one of those failed requests and see that a downstream pricing service is timing out (trace). You page the team responsible for the pricing service. The investigation that would have taken 45 minutes of grep and guesswork took 4 minutes.
That workflow — alert → logs → trace — is why all three pillars need to be in place before a service goes to production, not after the first 3 AM incident teaches the lesson the hard way.
Tooling Decisions for Lean Teams
You don’t need to build your own observability stack. For most SaaS startups, the right approach is:
- Grafana Cloud or Datadog for a managed, integrated stack (logs, metrics, traces in one UI)
- OpenTelemetry SDKs for vendor-neutral instrumentation
- Alertmanager or the vendor’s native alerting for on-call routing
If you’re on cloud infrastructure already — AWS, GCP, or Azure — the native observability products (CloudWatch, Cloud Monitoring, Azure Monitor) handle moderate scale without additional tooling overhead, and they’re often the fastest path from zero to something functional.
The failure mode to avoid is alert fatigue: over-indexed alerting that pages on-call for every minor anomaly. Start with fewer, higher-quality alerts — p99 latency crossing 3s, error rate above 1%, queue depth exceeding a threshold — and expand the alert set based on incidents, not intuition.
Observability isn’t a feature you add when the product is mature. It’s the foundation that makes reliable growth possible — the thing that lets you deploy multiple times a day with confidence, isolate incidents in minutes rather than hours, and catch regressions before your customers do.
Start your SaaS project with Nevrio — our engineering team builds observability in from day one, so your product ships with the instrumentation it needs to stay reliable as it scales.
